Building a Real-Time NBA/NBM Engine for Pharma Reps: From Data Architecture to Parking Lot Dashboard
There’s a version of omnichannel that most pharma companies have: multiple channels operating in parallel, each with its own analytics silo, none of them talking to each other in a way that changes what the rep does tomorrow morning.

Then there’s the version that actually works: a system where every channel’s data feeds a unified HCP profile, predictive models score that profile daily, and the output is a specific, actionable recommendation delivered to the rep before they walk into the office.
I recently built the second version end to end—from simulated omnichannel data generation, through feature engineering and model training, to a rep-facing dashboard prototype. This article walks through what I built, why each piece exists, and what it looks like when it all comes together. This isn’t a theoretical framework. It’s a working system.
The problem we’re actually solving
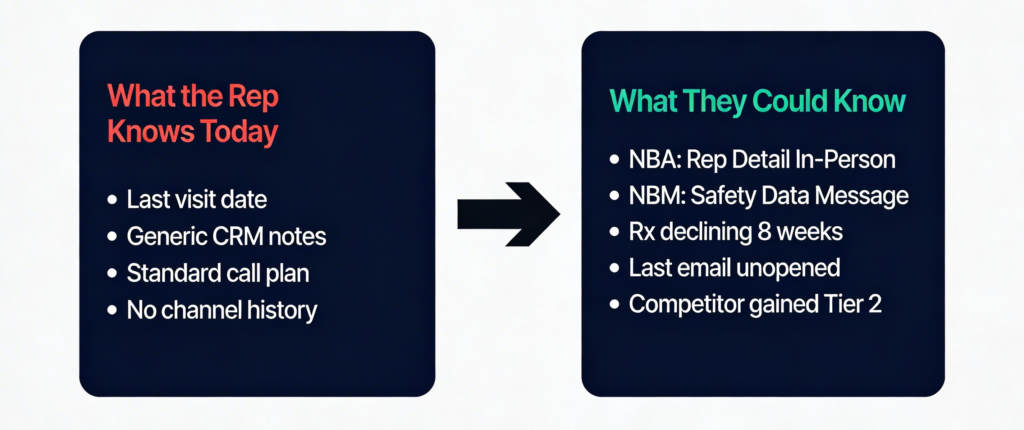
The pharma commercial model has a last-mile problem. Billions are invested in CRM infrastructure, digital marketing platforms, Rx data subscriptions, and analytics headcount. But the person who actually sits across from the HCP—the rep—walks in with, at best, a few CRM notes and their own memory.
They don’t know that the HCP opened an approved email about safety data but didn’t click through. They don’t know that the doctor attended a competitor’s speaker program last month. They don’t know that Rx volume has been quietly declining for eight weeks while a competitor gained formulary access.
The result: generic details, wasted time, and HCPs who disengage because nothing the brand says feels relevant to where they actually are in their decision process.
Industry data confirms this. Surveys consistently find that roughly 80% of HCPs feel that pharma communications are impersonal. Fewer than one in five feel genuinely engaged. The channels have been built. The orchestration hasn’t.
The data architecture underneath
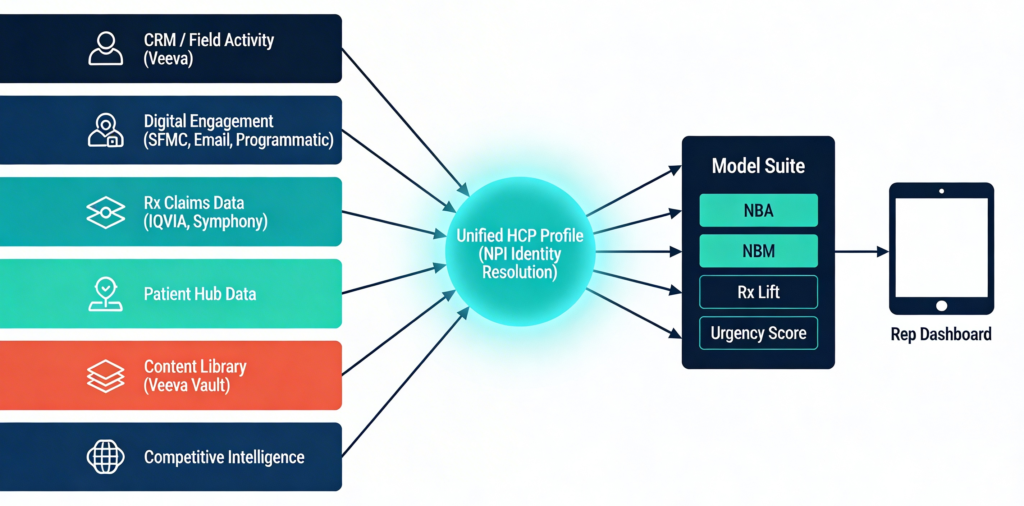
Any real NBA/NBM system starts with data integration. For this project, I created six interconnected datasets (simulated) that mirror what exists in a typical pharma commercial data environment:
- HCP Master Profile (500 HCPs): NPI, specialty, decile, behavioral segment, adoption ladder stage, journey stage, channel preference, access tier, payer mix, propensity scores, consent/opt-in flags. In real production, this can be sourced from Veeva CRM, IQVIA OneKey, and internal MDM systems.
- Engagement History (12,785 records): Every touchpoint—date, channel, message category, content asset, response outcome, duration, sentiment, trigger source, and journey stage at time of contact. Can be sourced from Veeva CRM, SFMC/Marketo, DSPs like DeepIntent, speaker bureau platforms.
- Rx Monthly Data (6,000 records): HCP-level TRx, NRx, RRx, competitor volumes, market share, switch-in/switch-out. Can be sourced from IQVIA XPonent or Symphony Health.
- Content Library (44 assets): MLR-approved content tagged by message category, journey stage, approved channels, format, and historical effectiveness score. Can be sourced from Veeva Vault.
- Model-Ready Features (73 columns per HCP): Pre-computed analytical table with everything the models consume. This is the output of the feature engineering pipeline.
- Rep Roster: Territory mapping. Simple but essential for filtering the dashboard to each rep’s universe.
The critical integration point is identity resolution—stitching Veeva Account IDs, IQVIA ME numbers, email subscriber keys, and anonymous digital device IDs back to a single NPI. In production, this is handled through partners like LiveRamp or Crossix. Match rates typically land between 70–85% for digital channels.
Feature engineering: where the signal lives
Raw CRM extracts and Rx data tables don’t predict much on their own. The predictive power comes from engineered features that capture behavioral patterns invisible in raw counts.
I built four categories of derived features totaling 20+ new variables:
Sequence features capture the order of touchpoints, not just the volume. Channel diversity (how many different channels an HCP has received), engagement acceleration (are the gaps between touches shortening, indicating increasing engagement intensity?), cross-channel transitions (how often does a digital touch precede a rep visit versus vice versa?), consecutive positive response streaks, and a time-weighted response momentum score that decays older interactions.
Rx trajectory features transform monthly prescription counts into trends. Linear growth rate, volatility (coefficient of variation), share trend, months of consecutive growth, current-versus-peak ratio, and a competitive pressure index that compares competitor growth to brand growth.
Saturation indicators flag when an HCP has been over-contacted on a specific channel. If a doctor has received more than six rep details in three months, the saturation flag fires. A fatigue signal compares positive response rates in recent interactions versus earlier ones—a declining rate suggests over-messaging.
Recency features are deceptively simple but powerful: days since last engagement, days since last rep visit, days since last email. Each independently drives different recommendation logic in the NBA model.
The model suite: six models, one decision
No single model can answer both “what channel” and “what message” while also prioritizing the call list and predicting response probability. The system uses six models working in concert:
The NBA model (Next Best Action) is an ensemble of multinomial logistic regression and a decision tree, trained on 36 features with a 70/30 stratified split. Test accuracy: 82.7%. The ensemble averages probability outputs from both models, then applies business rule overrides—zeroing out channels where consent is missing or access is restricted. The top predictive features: days since last rep visit, access tier, adoption ladder stage, average brand TRx, and rep detail saturation.
The NBM model (Next Best Message) uses the same ensemble architecture on 23 features focused on journey stage, message history, and Rx context. With 10 message categories, the 31.3% test accuracy is 3× better than random, and the top-3 ranked messages cover the correct answer approximately 65% of the time. The model outputs a full probability distribution, then applies a 1.5× boost to messages aligned with the HCP’s current journey stage—the single strongest predictive feature at 71.5 variable importance.
Six channel response probability models (one logistic regression per major channel) predict P(positive response) for each HCP on each channel. These are displayed in the dashboard so the rep can see, for example, that this particular HCP has a 30% positive probability for rep detail but 65% for a webinar.
An Rx Lift model (linear regression, R² = 0.457) connects engagement patterns to prescription volume change over the next period. Three Markov chain transition matrices capture optimal channel-to-channel, message-to-message, and journey stage sequencing. And a composite urgency score (six weighted components, 0–100 range) ranks every HCP in the territory for daily call prioritization.
Why this outperforms the traditional approach
The traditional pharma commercial model optimizes each channel independently. The rep team maximizes call reach and frequency. The digital team optimizes email open rates. Media optimizes CPM and viewability. Speaker programs track attendance. Each silo hits its own KPIs. But the HCP, who experiences all of these as one brand, gets a fragmented, repetitive experience.
An integrated NBA/NBM system changes the dynamic. When the model knows the HCP just attended a speaker program on efficacy data, it doesn’t recommend the rep lead with efficacy—it recommends moving to the next message in the journey sequence, perhaps patient selection or access support. When it detects that the last three emails went unopened, it shifts the channel recommendation away from email toward a different modality.
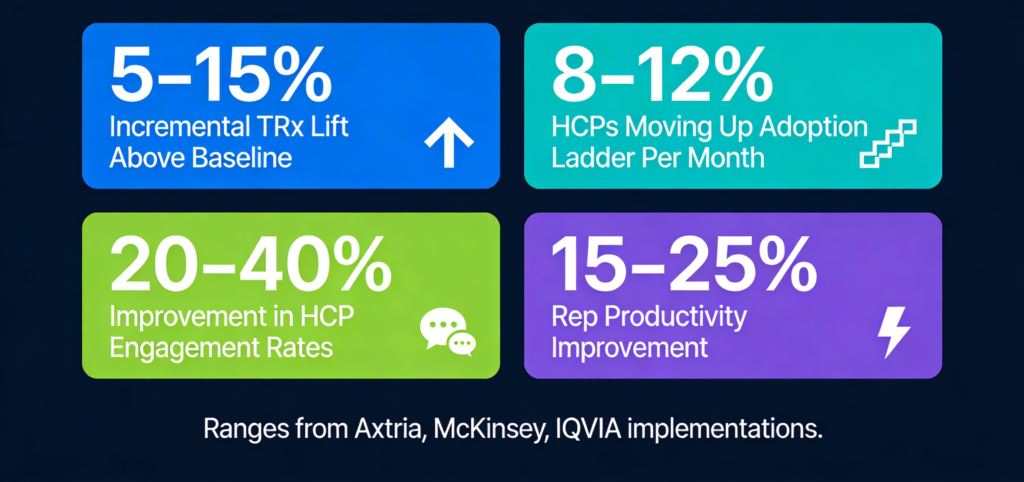
Published case studies from Axtria, McKinsey, and IQVIA report consistent result patterns from comparable implementations:
- 5–15% incremental TRx lift above baseline, driven by journey-aligned messaging and channel optimization
- 8–12% of HCPs moving across adoption ladder stages per month, identified through predictive analytics
- 20–40% improvement in positive HCP engagement rates
- Up to 10% higher marketing ROI from omnichannel-led digital engagement
The compounding effect is the real story. Because the system operates as a closed loop—every rep interaction generates engagement data that feeds back into the feature table, models are retrained monthly, and recommendations improve with each cycle—the performance gap between organizations with this capability and those without it widens over time.
The rep experience: sixty seconds in the parking lot
Everything described above is invisible to the rep. What they see is a single-screen dashboard:
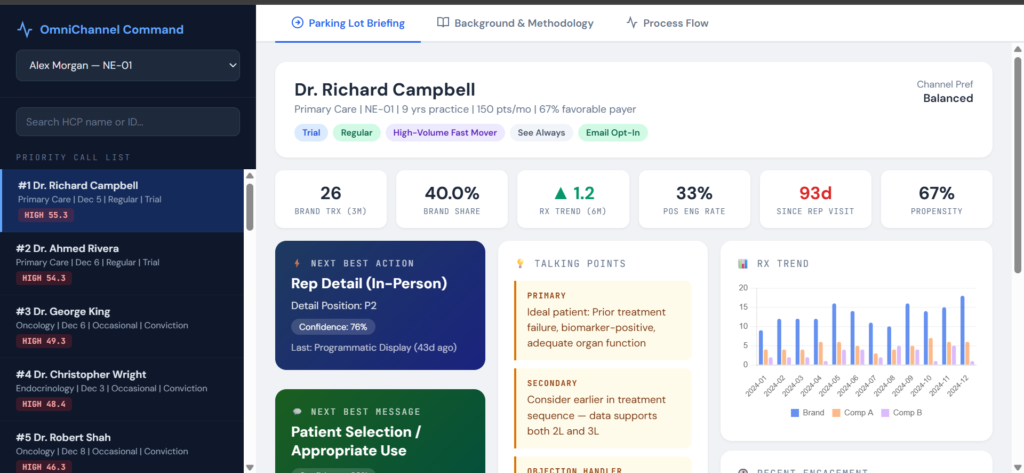
The sidebar shows their territory’s HCPs ranked by urgency score. They tap a name. The main panel loads: a profile strip (specialty, badges for journey stage, adoption stage, behavioral segment, access tier, consent status), six KPI boxes (Brand TRx, Share, Trend, Engagement Rate, Days Since Visit, Propensity), the blue NBA card (“Rep Detail In-Person, P1, 85% confidence”), the green NBM card (“Real-World Evidence, 95% confidence”), three talking points (Primary opener, Secondary follow-up, Objection handler), contextual alerts (Rx declining, competitor pressure, missing consent), and a color-coded engagement timeline showing the last ten touchpoints with response outcomes.
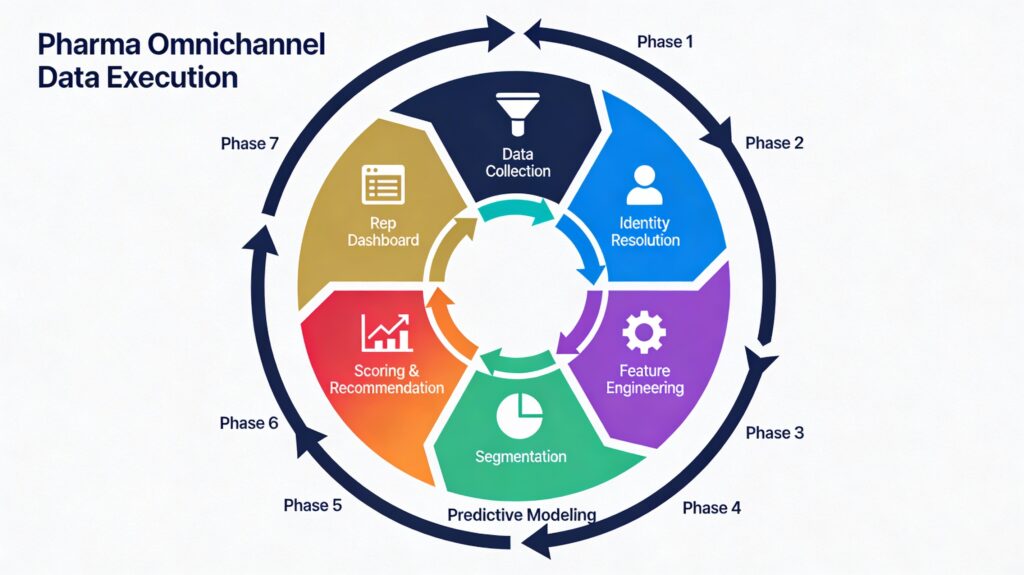
The dashboard also includes a Background & Methodology tab explaining every data source, transformation, and model in detail, and a Process Flow tab mapping the seven-phase pipeline from data collection through closed-loop optimization. These are for stakeholder education and onboarding, not daily rep use.
The total preparation time is sixty to ninety seconds. The rep walks in knowing: what to say, why, and what to be aware of.
Explore the working prototype
I’ve built a fully interactive prototype of this system with 76 HCPs across three territories, real model outputs, engagement histories, Rx trend charts, and all seven tabs. It’s not a mockup—it’s a working application you can explore.
You can access it here: [LINK TO DASHBOARD]
Select a rep identity. Browse the priority call list. Click into an HCP. See the recommendation. Read the talking points. Scan the timeline. Then switch to the Background tab to see the full methodology, or the Process Flow tab to understand the end-to-end pipeline.
The gap in pharma omnichannel has never been about the data or the technology. It’s about the analytical layer that translates infrastructure into field-level intelligence. The systems to collect the data exist. The platforms to deliver the recommendations exist. What’s been missing is the connective tissue in between.
That’s what this project demonstrates—not as a concept, but as a working system.
About the Author: Woranat Wongdhamma, PhD. Life sciences commercial analytics practitioner with 10+ years building forecasting models, resource optimization and measurement frameworks, omnichannel engines, and field intelligence systems. Creator of NicheLabz.
Email: woranat.wongdhamma@gmail.com | LinkedIn: https://www.linkedin.com/in/wworanat
Disclaimer
This prototype was built for demonstration and portfolio purposes only. All data presented—including HCP profiles, prescribing volumes, engagement records, and sales representative identities—is entirely fictional and synthetically generated. No real patient data, prescriber data, or proprietary commercial data was accessed or used in the creation of this project.
References to industry data sources (such as IQVIA, Symphony Health, Veeva, Crossix, etc.) are included solely to illustrate typical pharmaceutical commercial data architecture and do not imply any data licensing, partnership, or unauthorized access. All company and product names mentioned are trademarks of their respective owners and are used here for contextual reference only.
Any resemblance to real persons, healthcare providers, or organizations is purely coincidental.